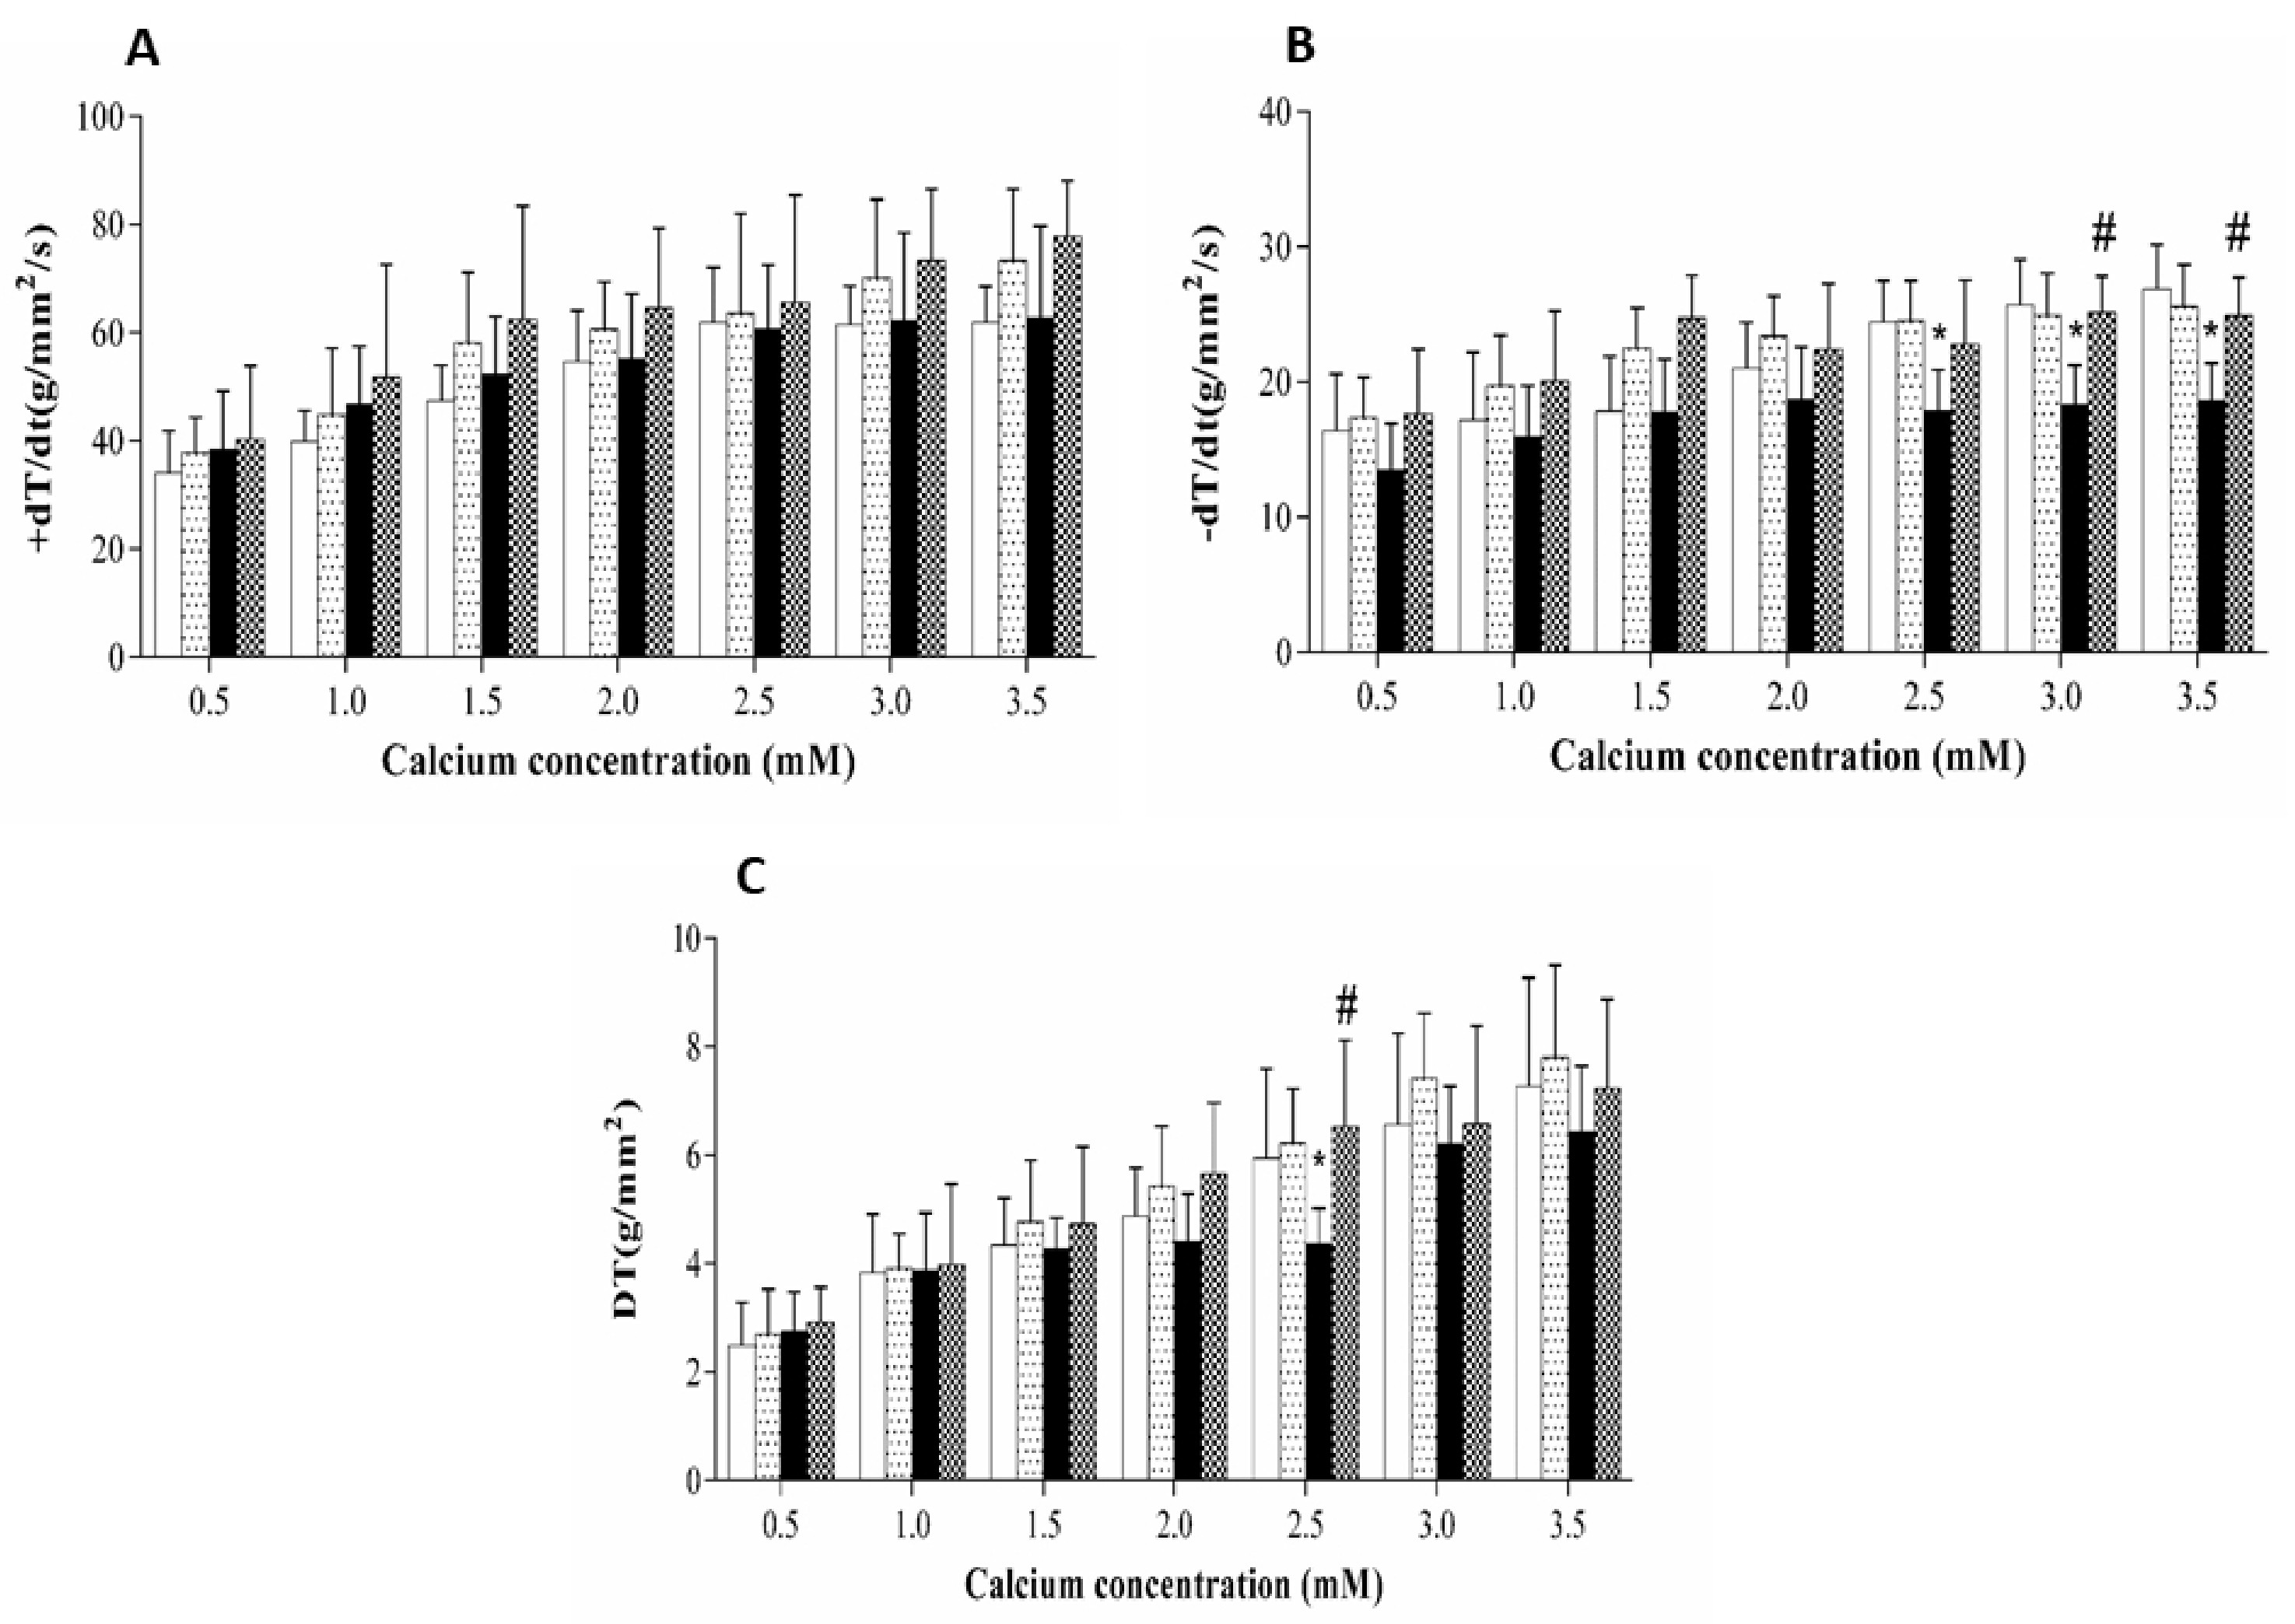
Fig. 3. Effects of increasing extracellular calcium concentration in papillary muscles. A- Maximum developed tension normalized per cross-sectional area [DT, g/mm2]; B- positive [+dT/dt, g/mm2 /s]; C- negative [-dT/dt, g/mm2 /s] tension derivative normalized per cross-sectional area of the papillary muscle. Data are expressed in mean ± standard deviation (n= 8 animals/group). Comparison by repeated-measures two-way ANOVA with Tukey post-hoc (p<0.05): *HSF vs Control; #HSF vs HSF + Ly.